The Golden Olden Days Were a Denominator Trick
Were students really smarter in the past? Before comparing generations, ask who stayed in school, who was excluded, and whose results were counted.
People love the old-school fantasy.
Some old exam floats around online. Some textbook page gets passed around. Someone quotes a founding father. Someone remembers the 1970s as if every kid walked into school carrying a lunchbox, a slide rule, and a working knowledge of the Federalist Papers. Then comes the conclusion: kids today are stupid, schools have collapsed, and people used to be educated.
Maybe schools have collapsed in plenty of ways. But that argument is still lazy.
Before we compare today's students to some golden olden day, we have to ask the question that ruins the whole story.
Who was counted?
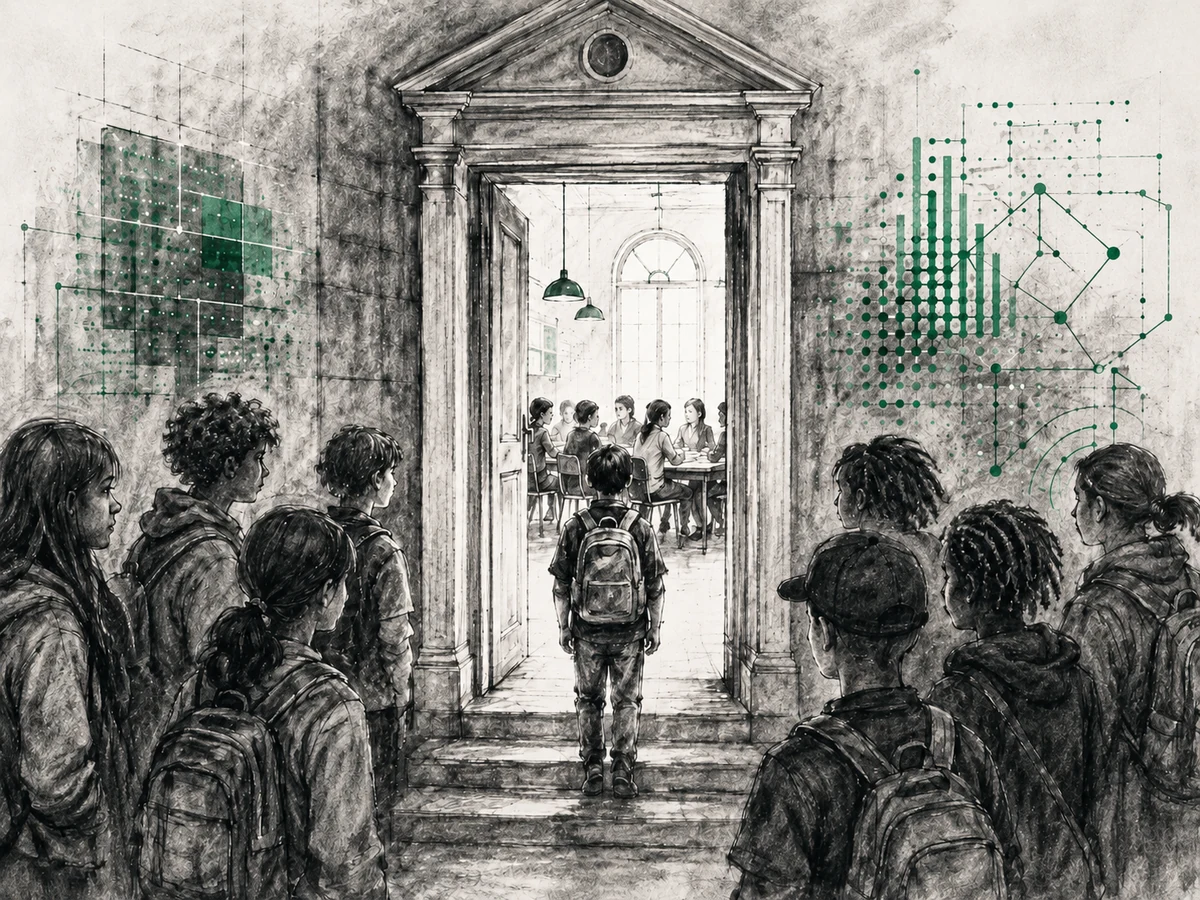
That is the part people skip. They compare today's entire messy student population to some filtered memory of the past. They compare every kid now to the kids who stayed in school then. They compare mass enrollment to selected enrollment. They compare a system that's supposed to serve nearly everyone to a system that often never had to keep everyone in the room.
That isn't a fair comparison. It isn't even a serious one.
The past produced brilliant people
Of course the past produced brilliant people. The founding generation had extraordinary minds. So did the nineteenth century. So did the early twentieth century. So did the 1950s, 1970s, 1990s, and today.
Every era has geniuses. Every era has serious readers. Every era has people who can think, write, argue, invent, build, and lead at an astonishing level. But elite examples are not evidence of broad public education.
Pointing to Jefferson, Hamilton, Adams, Franklin, Lincoln, or some famous self-taught mind doesn't tell us what the average young person could do. It doesn't tell us what the average farmer could read. It doesn't tell us what the average laborer understood. It doesn't tell us what girls were taught, what Black Americans were allowed to access, what immigrant children received, what disabled children were offered, what rural students got, or what happened to kids who left school early because work, poverty, exclusion, or family survival took priority.
A handful of brilliant people can make an era look smarter than it was. We have brilliant people now too. That doesn't prove our system works.
Who was actually in school?
The old-school comparison usually acts as if "students back then" means something stable.
It doesn't.
For a long stretch of American history, many young people were not in school in the way we now imagine. NCES's historical portrait of American education says enrollment for 5- to 19-year-olds stayed relatively low in the late nineteenth century, with roughly half of that age group enrolled. The overall rate rose from 51 percent in 1900 to 75 percent in 1940.1
That alone should wreck the fantasy, but the denominator problem goes deeper. The same NCES history says enrollment rates for Black children were much lower than for White children, that Black enrollment was largely limited before emancipation, and that by 1900 the gap between White and Black enrollment rates was still 23 percentage points. Enrollment rates kept rising after World War II, and by the early 1970s rates for both White and Black children had risen to about 90 percent.1
That matters. If only part of the population is in the system, the system gets to look better than it is. The missing students don't lower the average. The excluded students don't embarrass the institution. The dropouts don't show up as failed graduates. The kids who never reached the test are not evidence against the test.
So when someone says, "Look what eighth-graders used to know," the first response should not be awe. It should be suspicion.
Which eighth-graders? The ones still enrolled? The ones in that kind of school? The ones whose families could keep them there? The ones not already working? The ones not pushed out? The ones not hidden? The ones not absent from the comparison entirely?
Until we know that, the old exam proves a lot less than people think.
Literacy was not magic either
The same problem shows up with literacy. People talk as if the past had some deep shared literacy that we've now lost, but basic historical literacy data doesn't support that fantasy.
NCES reports that in 1870, 20 percent of people age 14 and older were illiterate. In 1900, the figure was 10.7 percent. In 1930, it was 4.3 percent. By 1979, it was 0.6 percent. Those numbers matter, but so does the warning underneath them: earlier measures were often about a very basic ability to read and write, while later concern shifted toward functional literacy.2
That difference is the whole problem.
"Can read and write" is not the same as "can read deeply." "Can sign a form" is not the same as "can understand an institution." "Can decode text" is not the same as "can reason through a claim." "Can graduate" is not the same as "is ready."
The word literacy sounds stable. It is not. It changes depending on what society expects people to read, understand, evaluate, and use. A person can be basically literate and still not be able to read a contract, a medical instruction, a lease, a political argument, a loan offer, a policy document, or the fine print of a system designed to take advantage of them.
So when people say the past was more literate, we have to ask what they mean. Do they mean more people could read at a basic level? The historical data doesn't say that. Do they mean some educated people read harder books? Sure. That's always been true. Do they mean the general public was deeply literate in a way the modern public is not? That is a much bigger claim, and it usually rests on vibes, nostalgia, and a few selected examples.
That is not evidence. That is a story people like.
Graduation used to mean something different
High school graduation is another place where the old comparison falls apart.
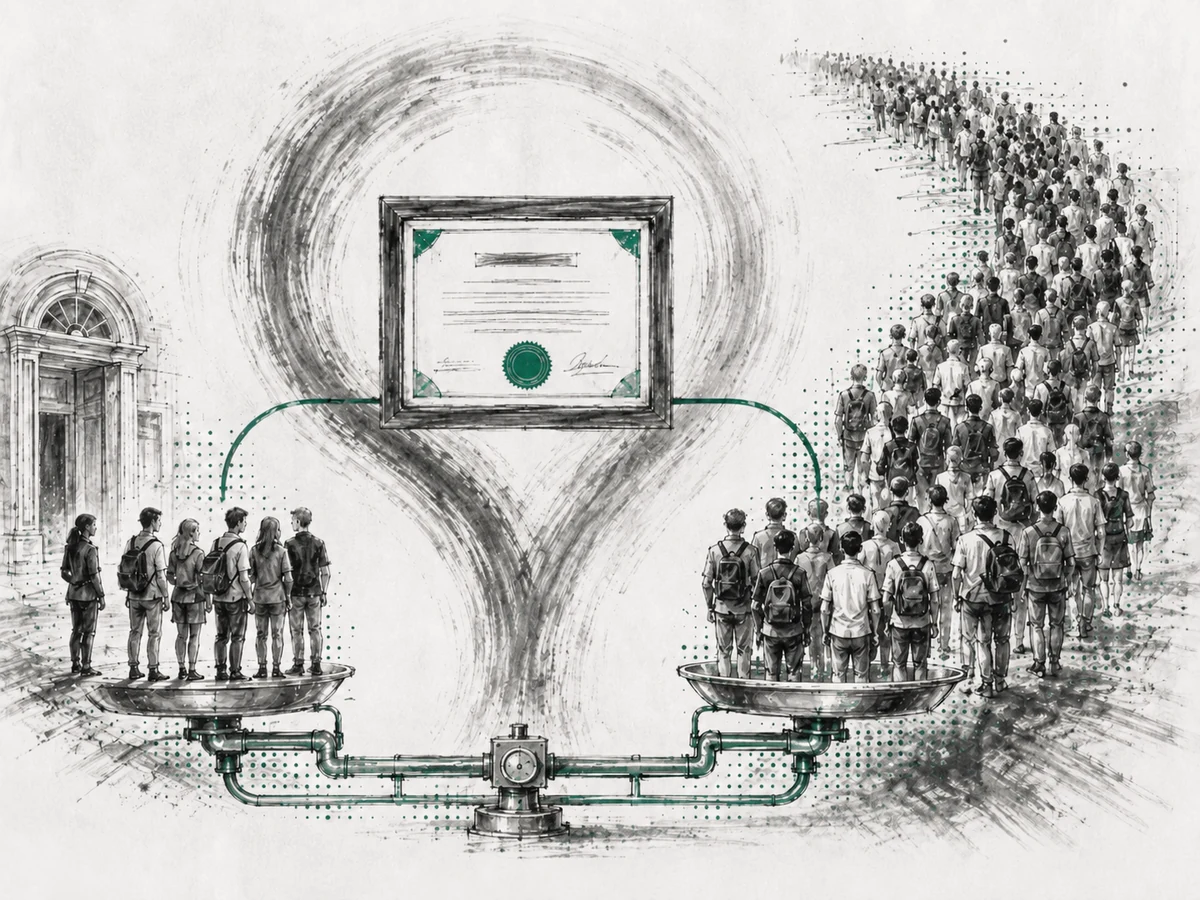
In 1869-70, high school graduates were equal to only about 2 percent of the 17-year-old population. In 1919-20, the figure was 16.8 percent. In 1929-30, it was 29 percent. In 1939-40, it was 50.8 percent. Even in 1959-60, it was 69.5 percent.3
So yes, a high school diploma used to signal something different. Of course it did. It represented a more selected group. Fewer people got there. Fewer people were expected to get there. Fewer people were held in the system long enough for the diploma to become the public symbol of success.
That doesn't mean every graduate was better educated.
It means the denominator was different.
If a credential goes from representing a small filtered group to representing most of the population, the credential changes. The meaning changes. The comparison changes. You can't treat the old diploma and the modern diploma as if they're the same object moving through time.
The seventies were not a magical exception
The 1970s and 1980s get their own version of this fantasy. People remember a world before smartphones, before online gradebooks, before graduation dashboards, before every weakness had an acronym and every initiative had a consultant.
Fine. There were real differences.
But memory is not data, and nostalgia is not analysis. A lot of people who talk about the 1970s as if schools were full of tough-minded, broadly educated students are remembering the kids who stayed visible to them. They're not remembering every absent kid, every pushed-out kid, every tracked kid, every kid who sat quietly and learned almost nothing, every kid who disappeared into work, family chaos, low expectations, discipline systems, special education black holes, or a diploma path that didn't ask the same thing from everyone.
The past didn't have fewer problems just because the problems were easier to ignore. That is one of the great tricks of school nostalgia. A system can look cleaner when it has less responsibility.
The modern system has its own trick
None of this means today's system is honest. That's the other trap.
Some people attack the golden olden days myth and then slide into a defense of the modern system. They point to higher enrollment, more graduates, more access, more services, more dashboards, more interventions, and more official concern.
There is truth in that. More people are counted now. More students are expected to stay in school. More students are publicly included in the system's responsibility. That matters.
But it doesn't prove students are becoming more capable.
Modern schooling has the opposite incentive problem from the old system. The older system often looked better because it didn't have to count everyone. The modern system often looks better because it has learned how to move more people through the categories.
Graduate more students. Recover more credits. Create more pathways. Adjust more definitions. Build more dashboards. Use better labels. Make the numbers move.
Some of that may reflect real improvement. Some of it may reflect compassion. Some of it may reflect better access for students who were ignored or excluded before. But some of it is also institutional self-protection.
A school system under pressure to raise graduation rates has an obvious incentive to make graduation easier to reach, easier to recover, easier to document, or easier to define in a way that protects the number. A system under pressure to show growth has an obvious incentive to choose measures, interventions, and stories that make growth visible. A system under pressure to prove legitimacy has an obvious incentive to treat its own labels as evidence.
That doesn't mean every number is fake. It means every number has to be interrogated.
The dashboard is not the student
Modern graduation rates look impressive until we ask what they prove.
NCES reports that the U.S. average adjusted cohort graduation rate for public high school students increased from 80 percent in 2011-12 to 87 percent in 2021-22.4 That may be good news. It may mean more students stayed connected. It may mean more students crossed a meaningful line. It may mean schools got better at helping kids finish.
But it may also mean the finish line changed.
A graduation rate doesn't tell us whether students can read well, reason with numbers, understand systems, make decisions, handle money, ask for help, evaluate claims, or function without constant adult management. It tells us they met the system's graduation rules.
Those are not the same thing.
The adult data should make us cautious, though it also has to be handled carefully. NCES's 2023 PIAAC results reported that the share of U.S. adults at the lowest literacy level rose from 19 percent in 2017 to 28 percent in 2023, and the share at the lowest numeracy level rose from 29 percent to 34 percent.5 NCES also warns that comparisons between 2023 and earlier PIAAC results should be made with caution because of changes in assessment and scaling methodology, including a tablet-based routing design and components that measured lower skill levels more precisely.6
That caveat matters. The PIAAC shift should not be used as a cheap dunk, as if one statistic proves schools caused adult decline. Adult literacy and numeracy are affected by many things, and measurement changes matter. The methodology change means we can't treat the 2017-to-2023 comparison as a clean, simple decline story.
But the caveat doesn't rescue the dashboard story either. Even under a cautious reading, adult-skills data is not the kind of evidence that lets graduation numbers settle the capability question. If more people are graduating, and we still have serious reason to worry about adult literacy and numeracy, the honest response is not celebration.
The honest response is: what exactly are we counting?
Both stories protect the system
The old story says students used to be better. The new story says the numbers are improving. Both stories can hide the same failure.
The old story hides who was excluded. The new story hides what was redefined. The old story points to selected students and pretends they represent the public. The new story points to public metrics and pretends they represent capability.
Both can be used to avoid the harder question.
What can the young person actually do?
That is the question school keeps dodging because it's much harder to fake. It's easier to say a student passed English than to prove the student can read something that matters and understand what it is asking. It's easier to say a student passed math than to prove the student can reason through a loan offer, a chart, a paycheck, a risk, or a public claim. It's easier to say a student is on track than to prove the student can navigate a system without being carried by adults.
The label is convenient. Capability is harder.
What if we used a different lens?
The real test would be to take the same students and look at them through a different lens.
Not the nostalgic lens: could they pass some old exam from a world where many students were never in the room?
Not the dashboard lens: did they graduate, earn credits, complete interventions, and move through the system on schedule?
A capability lens.
Can they read something that matters and understand what it's asking of them? Can they handle money without being easy prey? Can they interpret a chart, a claim, a contract, a policy, a medical instruction, a loan offer, a work schedule, a political argument, or a system that was not designed to help them?
Can they ask a good question, explain what they need, recover from confusion, and keep moving when no adult is standing there turning the problem into an assignment?
Some students who look bad on school paper would probably look better through that lens. Some students who look successful on school paper would probably look worse. Most would look uneven, which is what real humans usually are.
But at least we would be asking a real question.
Do not trust the system as its own witness
I don't trust the golden-olden-days story. I also don't trust the modern dashboard story.
The old story often hides who was counted. The new story often hides what was redefined. Both stories ask us to accept school's account of itself.
I would not.
School systems are not neutral witnesses. They are interested parties. They define the categories, collect the numbers, adjust the rules, report the outcomes, and then ask families to treat the result as truth.
That is too much trust.
A system with this much incentive to protect its numbers should not be treated as the final authority on what a young person knows, understands, or can do.
Use school where it helps. Use good teachers, good classes, useful tests, and real credentials when they actually build capability. A great school can matter. A serious teacher can change a life. A real class can open doors.
But don't hand the system the steering wheel and assume its labels mean what they claim.
The question is not whether the school says the child is on track. The question is whether the child can actually do the thing.
If you are trying to think this through for your own family, pick one official success label your child has already earned: a grade, a credit, a test score, a course title, a diploma path. Then ask the uncomfortable question underneath it: what does this actually prove?
If the answer is not clear, that is where the real education work begins.
If you are wrestling with this for your own family, send the label you are trying to understand through the contact page: what it says, what it claims to prove, and what you're not sure your child can actually do yet.
Send the label through the contact page
Source notes
- NCES, 120 Years of Literacy, excerpting Chapter 1 of 120 Years of American Education: A Statistical Portrait, enrollment-rate discussion. The text reports that roughly half of 5- to 19-year-olds were enrolled in the late nineteenth century, that overall enrollment rose from 51 percent in 1900 to 75 percent in 1940, that the White/Black enrollment gap narrowed from 23 points in 1900 to 7 points in 1940, and that by the early 1970s rates for both White and Black children had risen to about 90 percent. source
- NCES, 120 Years of Literacy: adult illiteracy history and the shift from basic read/write measures toward functional literacy concerns. source
- NCES Digest of Education Statistics, Table 219.10, historical high school graduates as ratio of the 17-year-old population. source
- NCES Condition of Education and Digest of Education Statistics Table 219.46: U.S. public high school adjusted cohort graduation rate increased from 80 percent in 2011-12 to 87 percent in 2021-22. Condition of Education Digest Table 219.46
- NCES PIAAC 2023 Highlights of U.S. National Results: lowest literacy level increased from 19 percent in 2017 to 28 percent in 2023; lowest numeracy level increased from 29 percent to 34 percent. source
- NCES PIAAC 2023 Technical Notes: comparisons with 2012/14 and 2017 should be made with caution because of assessment and scaling changes; Cycle 2 used a tablet locator with more low-to-medium items for routing and incorporated components data to improve precision at the bottom of the skills distribution. source